What if you could generate professional-grade, real-time resource graphs—like Host CPU/Memory utilization—and store them directly as Image Resource Elements inside vRO itself?
Today, I will be talking about one such POC in this post. By combining the power of vRO’s Python Action Environments, the pyVmomi SDK, and Matplotlib, and vRO ByteBuffer class, we will try to turn vRO into a graphing engine.
Download the vRO package here.
🏗️ The Architecture: How It Works
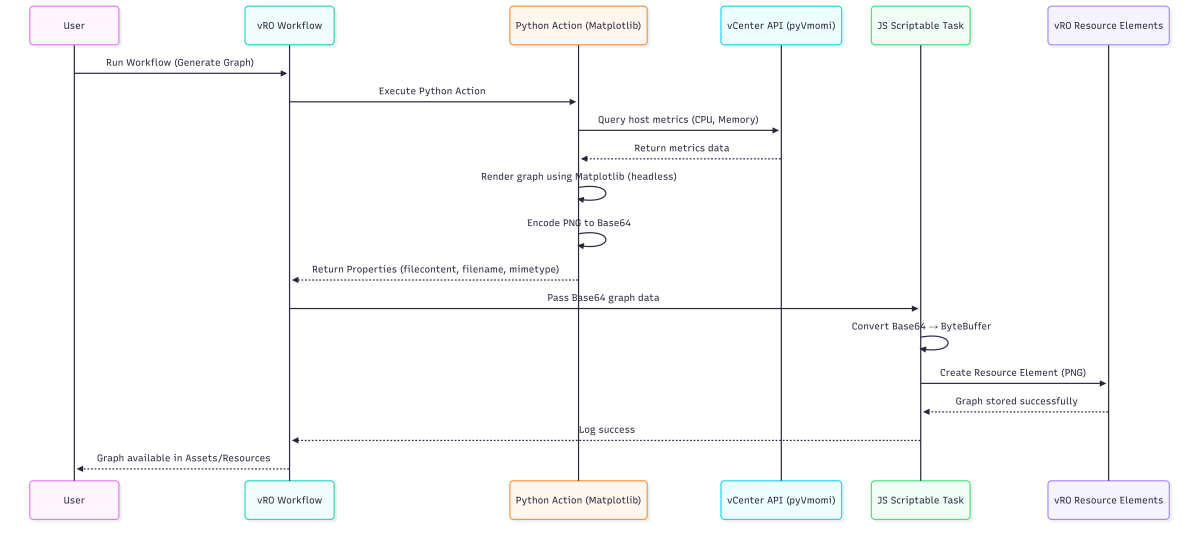
Generating an image inside a vRO workflow involves a specific three-step pipeline to ensure the binary image data isn’t corrupted during transfer.
- Fetch (The Python Action): We use a Python-based Action to connect to vCenter via
pyVmomiand retrieve real-time metric data (e.g., CPU, Memory, VM density). - Render (Matplotlib): Within the same Python script, Matplotlib “paints” this data into a high-resolution bar chart in memory, completely headless. The image is then encoded into a Base64 string.
- Store (The JS Task): A JavaScript Scriptable Task takes that Base64 string, converts it back into pure binary data, and saves it directly into the vRO Assets > Resources folder.
Secret Sauce Handling Binary Data in vRO is relatively difficult but to solve this, this guide utilizes a brilliant technique detailed by Krisztian Kuklis in his post on Handling vRO8 HTTP Binary Files.
🛠️ Step-by-Step Implementation
Step 1: Prepare the Python Environment
Before writing any code, vRO needs the right libraries.
- Navigate to Infrastructure > Action Environments.
- Create a new Python Environment.
- Add
pyvmomiandmatplotlib

Step 2: The Python Graphing Action
Create a new vRO Action named generateHostUtilizationGraph. Set the runtime to the Python environment you just created, and define the Return Type as Properties.
Here is the complete Python script. Notice the critical matplotlib.use('Agg') line—this ensures Matplotlib runs in “headless” mode without trying to open a physical display window.
import matplotlib
matplotlib.use('Agg') # Essential for headless vRO environments
import matplotlib.pyplot as plt
from pyVim.connect import SmartConnect, Disconnect
from pyVmomi import vim
import ssl, base64, io, datetime
import numpy as np

def handler(context, inputs):
    # 1. Connect to vCenter
    si = SmartConnect(
        host="your-vcenter.lab.local",
        user="administrator@vsphere.local",
        pwd="YourPassword!",
        sslContext=ssl._create_unverified_context()
    )

    try:
        content = si.RetrieveContent()
        container = content.viewManager.CreateContainerView(content.rootFolder, [vim.HostSystem], True)

        host_names = []
        cpu_usage_pct = []
        mem_usage_pct = []

        # Collect live stats from hosts
        for host in container.view:
            if host.runtime.connectionState != "connected":
                continue

            summary = host.summary
            stats = summary.quickStats
            hw = summary.hardware

            host_names.append(host.name)

            total_cpu_mhz = int(hw.numCpuCores) * int(hw.cpuMhz)
            cpu_usage_pct.append(round((stats.overallCpuUsage / total_cpu_mhz * 100), 1) if total_cpu_mhz > 0 else 0)

            total_mem_mb = hw.memorySize / (1024 * 1024)
            mem_usage_pct.append(round((stats.overallMemoryUsage / total_mem_mb * 100), 1) if total_mem_mb > 0 else 0)

        # 2. Render the Graph
        x = np.arange(len(host_names))
        width = 0.35

        # Large canvas for visibility
        fig, ax = plt.subplots(figsize=(14, 10))

        rects1 = ax.bar(x - width/2, cpu_usage_pct, width, label='CPU Usage %', color='#3b82f6')
        rects2 = ax.bar(x + width/2, mem_usage_pct, width, label='Mem Usage %', color='#10b981')

        ax.set_ylabel('Usage Percentage (%)')
        ax.set_title(f'Host Utilization Report - {datetime.datetime.now().strftime("%Y-%m-%d %H:%M")}', pad=20)
        ax.set_xticks(x)

        # Rotate long labels and anchor them
        ax.set_xticklabels(host_names, rotation=45, ha='right', fontsize=10)
        plt.subplots_adjust(bottom=0.35) # Reserve space for long FQDNs/IPs

        ax.legend(loc='upper right')
        ax.set_ylim(0, 115)

        ax.bar_label(rects1, padding=3, fmt='%.1f%%')
        ax.bar_label(rects2, padding=3, fmt='%.1f%%')

        # 3. Save to Base64
        buf = io.BytesIO()
        plt.savefig(buf, format='png', bbox_inches='tight', dpi=100)
        buf.seek(0)
        img_b64 = base64.b64encode(buf.read()).decode('ascii')

        plt.clf()
        plt.close('all')

        ts = datetime.datetime.now().strftime("%Y%m%d_%H%M%S")

        return {
            "filecontent": img_b64,
            "filename": f"HostReport_{ts}.png",
            "mimetype": "image/png"
        }

    finally:
        if si:
            Disconnect(si)
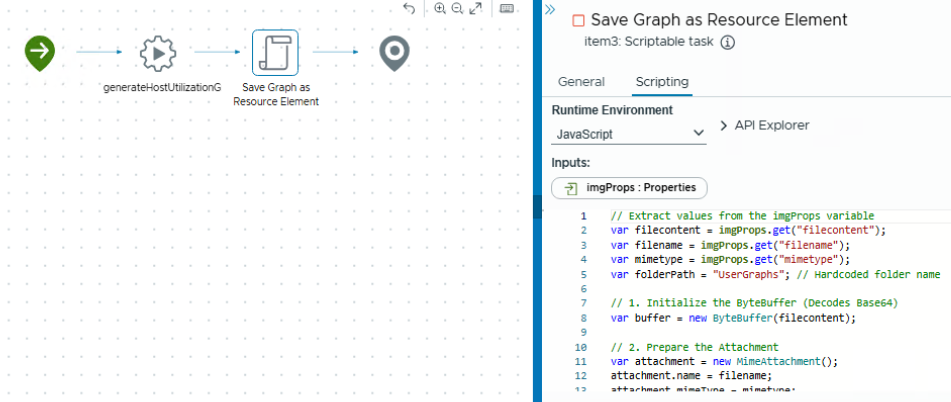
Step 3: The JavaScript Binary Bridge
Create a workflow. Drag your Python Action onto the canvas, and map its output to a variable called imgProps.
Next, add a Scriptable Task directly after it. This is where we implement the Kuklis method to safely store the image.
// Input: imgProps (Properties)

var filecontent = imgProps.get("filecontent");
var filename = imgProps.get("filename");
var mimetype = imgProps.get("mimetype");
var categoryPath = "AutomatedReports";

try {
    // Re-hydrate the Base64 string into pure binary using ByteBuffer
    var buffer = new ByteBuffer(filecontent);
    var attachment = new MimeAttachment();
    attachment.name = filename;
    attachment.mimeType = mimetype;
    attachment.buffer = buffer;

    // Get or Create the vRO Resource folder
    var folder = Server.getResourceElementCategoryWithPath(categoryPath);
    if (!folder) folder = Server.createResourceElementCategory(null, categoryPath);

    // Save as a native vRO Resource Element
    var resource = Server.createResourceElement(folder.path, filename, attachment);
    resource.setContentFromMimeAttachment(attachment);

    System.log("Successfully generated and saved graph: " + filename);
} catch (e) {
    System.error("Failed to save graph: " + e);
}
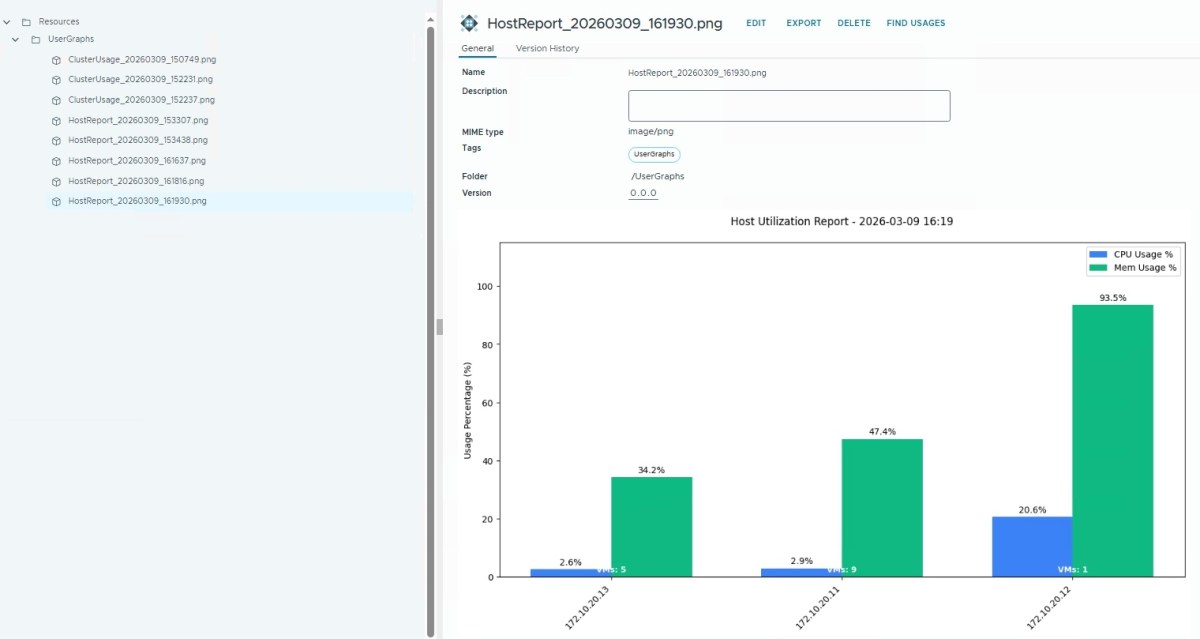
📸 The Result
Run the workflow! Navigate to Assets > Resources > UserGraphs in your vRO client. You will see a perfectly rendered, timestamped PNG file.
Check various types of graph options at https://matplotlib.org/stable/gallery/index.html
Because the script uses a dynamic timestamp (YYYYMMDD_HHMMSS), you are effectively building a visual audit trail of your infrastructure’s health directly within your automation platform.
🚀 Future Use Cases: VCF and Private AI
While mapping CPU and Memory is a fantastic starting point, this visualization technique unlocks massive potential for the future of the Software-Defined Data Center, particularly as organizations adopt VMware Cloud Foundation (VCF) and Private AI architectures.
- Private AI GPU Tracking: As you deploy Large Language Models (LLMs) on VCF, you can query NVIDIA vGPU metrics via API. Use this graphing engine to generate daily “Inference Health” charts showing GPU memory consumption and temperature over time.
- VCF Compliance Heatmaps: Instead of a massive CSV file detailing NSX distributed firewall hits, query the Aria Logs API and render a visual “Security Heatmap,” storing it as an image for quick managerial review.
- Capacity Forecasting: Plot historical data from Aria Operations to create “Burn-down” charts. Show your platform teams exactly when a specific workload cluster will run out of NVMe storage.
- Anything-as-a-Graph
By treating images as programmable infrastructure data, your vRO instance transforms from a simple task executor into an intelligent, visual operations hub.
Discover more from Cloud Blogger
Subscribe to get the latest posts sent to your email.