Introduction
If you are looking on how to use breakpoints and expression in vRealize Orchestrator, you are probably at right place. Debugging is crucial for every programming interface and vRO is not lacking there. Debug option in vRO exist for a long time now. But its real power uncovered recently with version 8.0 onwards. See how a vRO programmer can quickly use the full potential of Debugger in the video below and then we will see the process in details.
Quick Demo video
Step-by-step Guide
To understand the whole debugging process, we will take an action with 2 inputs and do a sum of 2 numbers. Catch will be that one input is a number and other is a string due to human error.
Step 1: Reproduce the bug
Finding a series of actions that consistently reproduces a bug is always the first step to debugging.
- Create an action with 2 inputs

- In the action script, put this code
var sum = number1 + number2;
System.log(number1 + " + " + number2 + " = " + sum);- Save and Run it
- Enter
5in the number1 text box. - Enter
1in the number2 text box.
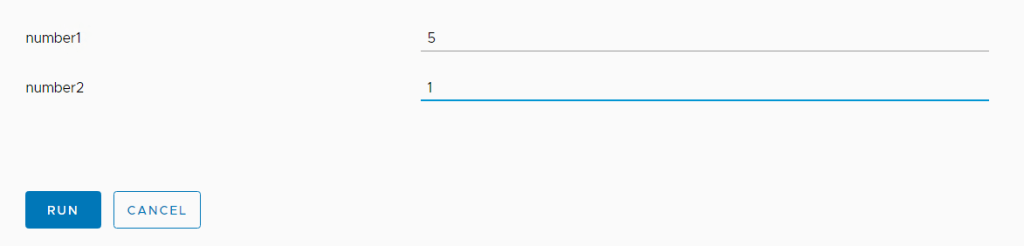
- The log will show
51. The result should be6. This is the bug we’re going to fix.

Step 2: Pause the code with a breakpoint
A common method for debugging a problem like this is to insert a lot of System.log() or System.debug() statements into the code, in order to inspect values as the script executes.
The System.log() method may get the job done, but breakpoints can get it done faster. A breakpoint lets you pause your code in the middle of its execution, and examine all values at that moment in time. Breakpoints have a few advantages over the System.log() method:
- With
System.log(), you need to manually open the source code, find the relevant code, insert theSystem.log()statements, and then save it again in order to see the messages in the log console. With breakpoints, you can pause on the relevant code without even knowing how the code is structured.
Lets see how to use line-of-code breakpoints:
On the left side of the code line count, look for a reddish dot and double tap to make it dark red. You have set breakpoint on that line. Next time while we debug, the code will pause on the breakpoint that you just set.
Step 3: Open Debugger Mode
Important While working on actions, Debugger Mode will only open if there is at least 1 breakpoint in the code. While working on workflows, there are 2 ways to set breakpoint. Either inside the scriptable task or on the item itself. Click the red box on top left of an item to set breakpoint.

- On the top, select Debug

- You will notice a new tab Debugger in the bottom panel with Watch expressions and Item Variables boxes.
- The execution will start and will pause at first breakpoint. The breakpoint where the execution is currently paused can be identified with a red star
 instead of red dot
  .
.

Step 4: Step through the code and use expressions
Stepping through your code enables you to walk through your code’s execution, one line at a time, and figure out exactly where it’s executing in a different order, or giving different results than you expected.
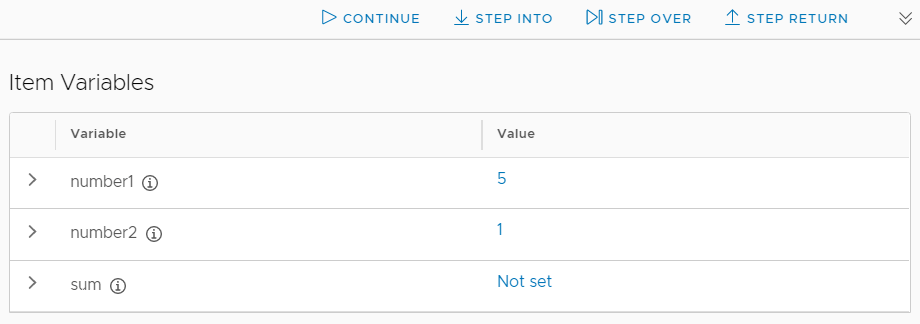
Tip We can step through the code using Continue, Step Into, Step Over & Step Return buttons.

Continue: An action to take in the debugger that will continue execution until the next breakpoint is reached or the program exits.
Step Into: An action to take in the debugger. If the line does not contain a function it behaves the same as “step over” but if it does the debugger will enter the called function and continue line-by-line debugging there.
Step Over: An action to take in the debugger that will step over a given line. If the line contains a function the function will be executed and the result returned without debugging each line.
Step Return: An action to take in the debugger that returns to the line where the current function was called.
- Once you click Debug, vRO will suspend
 the execution on first breakpoint which will be on
 var sum = number1 + number2; - Click Continue or Step into to execute that step and check the value of sum.
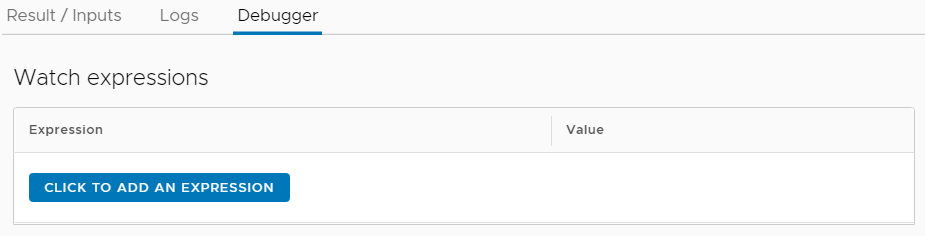
The Watch Expressions tab lets you monitor the values of variables over time. As the name implies, Watch Expressions aren’t just limited to variables. You can store any valid JavaScript expression in a Watch Expression. Try it now:

- Click the Watch expressions tab.
- Click on Click to Add an Expression.
- Type
parseInt(number1) + parseInt(number2) - Press
 . It shows parseInt(number1) + parseInt(number2) = 6.
This implies that the type of either or both of the number variables is not a number as parsing integer value out of them gives right result.
Step 5: Apply a fix
You’ve found a fix for the bug. All that’s left is to try out your fix by editing the code and re-running the demo. You don’t need to leave Debugger mode to apply the fix. You can edit JavaScript code directly within the workflow editor there.
Final Note
That is how you can start using the Debugger in vRO. Over time, you will be able to debug complex code without using persistent log methods as well as building logic on the go right while executing the code using expressions etc. That’s all in today’s post, see you on other posts. Cheers.
Discover more from Cloud Blogger
Subscribe to get the latest posts sent to your email.